11 - 23 - 08 US Dollar |
|
13984
12
| |
|
make money and make fun
|
|
| |
|
篇篇起舞...全职妈妈。兼职炒汇。
|
|
| |
|
Opportunities multiply as they are seized
|
|
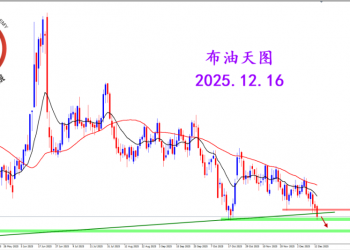
 2025.12.16 图文交易计划:布油开放下行 关2404 人气#黄金外汇论坛
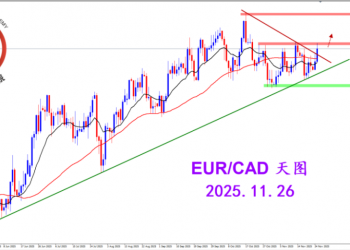
 2025.11.26 图文交易计划:欧加试探拉升 关3133 人气#黄金外汇论坛
 MQL5全球十大量化排行榜3183 人气#黄金外汇论坛
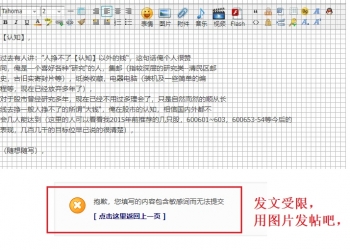
 【认知】5985 人气#黄金外汇论坛