Sure it is.
Wave B in either flat or zigzag correction pattern could be very complicated.
In other words, if you couldn't distinguish or understand what is the price moving pattern, it is most likely in contructing wave B.
Don't take any analysis as grant. An analysis gives you only a list of likehoods, even a quiet sophisticated one.
Carefully selecting one of likehoods, make your own trade plan. As you intend to carry out a trade, better to enter at both ends of any specified likehood.
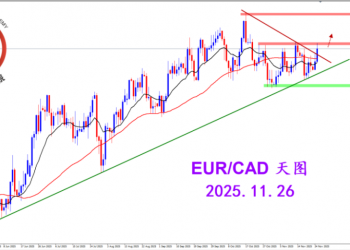
For example, assume it is true the case on top's chart, price is limited by 1.2927, then short this pair within 1.2850 -- 1.2900 with stop loss above 1.2927, target :
1) treat following downside moving as correction --- 0.5;, 0.618; 0.786; ... other Fib ratios, then 1.2384, as the first target ;
2) as price below 1.2384, consider the price is forming diagonal triangle moving pattern started from 1.3117, then watch down distance no less than 543 dips (1.2927 --- 1.2384) due to subwave c - 5 > c - 3 in expanding variety diagonal triangle moving pattern.
similar to above in making your own trade plan if try other likehood.