(转帖)Indicators are overhyped |

| |

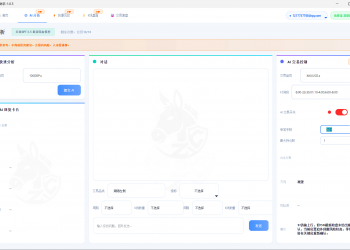 GPT5.5全新大模型优化金融分析领域,以实现1392 人气#黄金外汇论坛
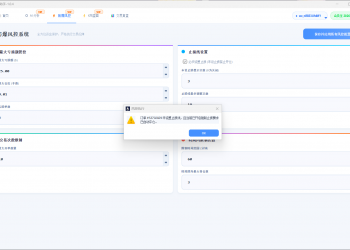 爆仓熔断,风险管控,避免雪崩烧“屋”2287 人气#黄金外汇论坛
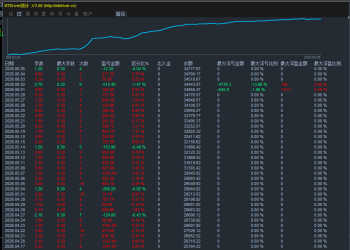 黄金五限策略2217 人气#黄金外汇论坛
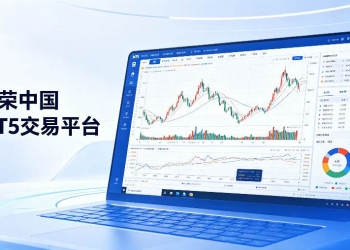 MT5精确控制图表显示:如何一屏固定显示1002663 人气#黄金外汇论坛
投诉/建议联系
微信/QQ:771081939

|Archiver|手机版 Mobile Version|关于我们 About Us|联系我们 Contact Us
Copyright © 2026 金股汇论坛(Y2论坛) 版权所有 Powered by Discuz! X3.5

 提升卡
提升卡 置顶卡
置顶卡 沉默卡
沉默卡 喧嚣卡
喧嚣卡 变色卡
变色卡 显身卡
显身卡

 微信微信
微信微信 官方微博
官方微博