If you compare carefully the 4-hourly chart and daily chart of euro/us dollar downside moving from 1.6037 and US Dollar index rallys from 71.18, you may make better sense about "negative reversal 在弱势中产生".
"局部弱势" --- indicates the "弱势" only appearing in smaller time frame.
For example, if trend on daily chart appears a strong market, hourly chart appears a weak market, which indicates that price is under correction. Of cause, after correction, price will resume previous trend, rally again. If the correction is to form wave 2, the next rally should be wave 3 --- "一波对应 wave 1 的上涨走势" , but target should correspond to the sequential wave. |
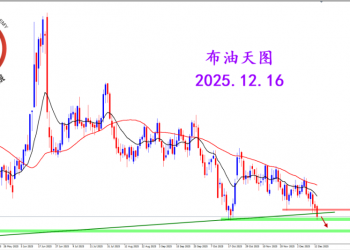
 2025.12.16 图文交易计划:布油开放下行 关2555 人气#黄金外汇论坛
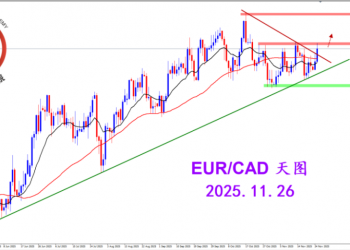
 2025.11.26 图文交易计划:欧加试探拉升 关3167 人气#黄金外汇论坛
 MQL5全球十大量化排行榜3227 人气#黄金外汇论坛
 【认知】6015 人气#黄金外汇论坛